Error bars can be used to show either the range of the data or the Standard Deviation.
1.1.2 Calculate the mean and standard deviation of a set of values.
The standard deviation is used to assess how far the values are spread above and below the mean. It is calculated by entering data into a graphic display or scientific calculate and pressing the stand deviation function key.
CASIO fx-9860GII
- Turn the calculator on
- Press menu and go to stat (2) and press enter.
- Input data into List 1
- Press F2 (CALC) after all data and F1 (1VAR)
- σx is the standard deviation (4th line)

TI-84 plus
- Turn the calculator on
- Press the stat key and press enter
- Input data into L1
- After all the data has been entered, press the stat key again and shift across to select CALC and press enter
- Press the 2nd key followed by the L1 and enter. This will give information about your set of data.

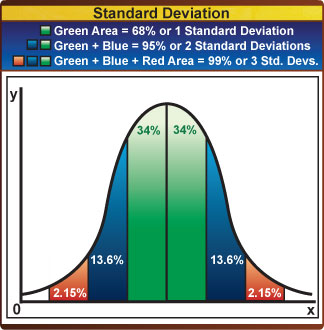
1.1.3 State that the term standard deviation is used to summarize the spread of values around the mean, and that 68% of the values fall within one standard deviation of the mean.
For normally distributed data, 68% of all values lie within ±1 standard deviation (s or σ) of the mean. This rises to about 95% for the ±2 standard deviations.
Note: Standard Deviation only works with a normal distributed curve. Skewed graphs don't work as it has outliners.
1.1.4 Explain how the standard deviation is useful for comparing the means and the spread of data between two or more samples.
A small standard deviation indicates that the data is clustered closely around the mean value. Conversely, a large standard deviation indicates a wider spread around the mean.
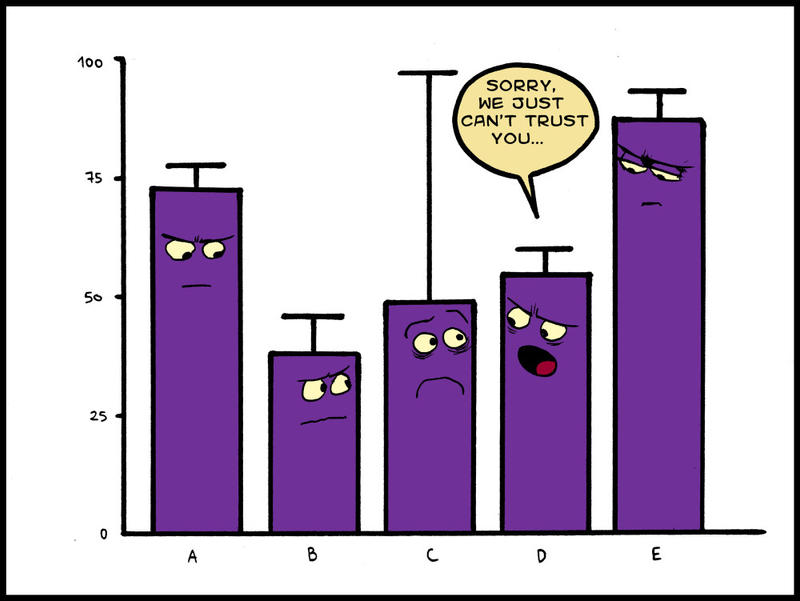
One way to take into account the variability in the results and hence their level of accuracy is to draw error bars. A simple way to construct an error bar is to use the maximum deviation of a single data point away from the mean. When drawing a graph an error bar is drawn above and below the mean that shows the maximum deviation away from the mean.
If the error bars overlap then it cannot be concluded that the values are truly different. In biology we state the values are not significantly different and vice versa.

Note: Null Hypothesis (H0) is a statement in biology to state that there is no relationship between two sets of data. The opposite is the alternative hypothesis (H1)
1.1.5 Deduce the significance of the difference between two sets of data using calculated values for t and appropriate.
T Test.
T test is a statistical test. The T test is a technique which will take into account the means as well as the amount of overlap between two sets of data and say how certain we are that there is a significant difference.
This is the simple formula for the t test. Note: you are not required to remember this, however it would be beneficial to understand the mechanism behind the t test.

X1 is the mean value for data set 1
The top equation (X1-X2) requires to be a positive difference, irrespective of which is bigger.
S is the symbol for the standard deviation
N is the number of measurements collected.

On the other hand if two sets of data have means that are close together and large variances (the data is spread from the mean) they will have a large overlap and a small value of t, they can not be shown to be significantly different.
Therefore, a large number of t indicates little overlap and a significant difference and vice versa.
Critical Value.
To judge whether the value of t is big or small, you have to consult a table known as "A table of critical values". The value that should be looked at in the table depends on something known as "The degree of freedom".

To work out the degree of freedom = number of classes - 1
So if there were 21 individual in each sample then the degrees of freedom would equal:
Degree of freedom = (21-1) + (21-1)
Degree of freedom = 40
Significance levels are normally used at the p = 0.05 or 5% (Biologist usually look at this level), "during exams, significance levels are stated in the questions". From the graph we could see that the critical value will be 2.021.
Conclusion
If a value of t is greater than or equal to the critical value then the null hypothesis can be rejected and it can be stated that there is a significant difference.
t ≥ cv rejects H0 Hypothesis and vice versa.
1.1.6 Explain that the existence of a correlation does not establish that there is a casual relationship between two variable.
Correlation is a statistical method that answers the question "Are these two variables associated?" In other words, if one variable changes, does the other change too? This uses a "scatter graph".
There are two types of association, positive association is when the graph shows x=y, which means the line of best fit slopes upwards. On the other hand, a negative association is when the graph shows x=-y, which means the line of best fit slopes downwards. If there are no association then points will be distributed randomly.
